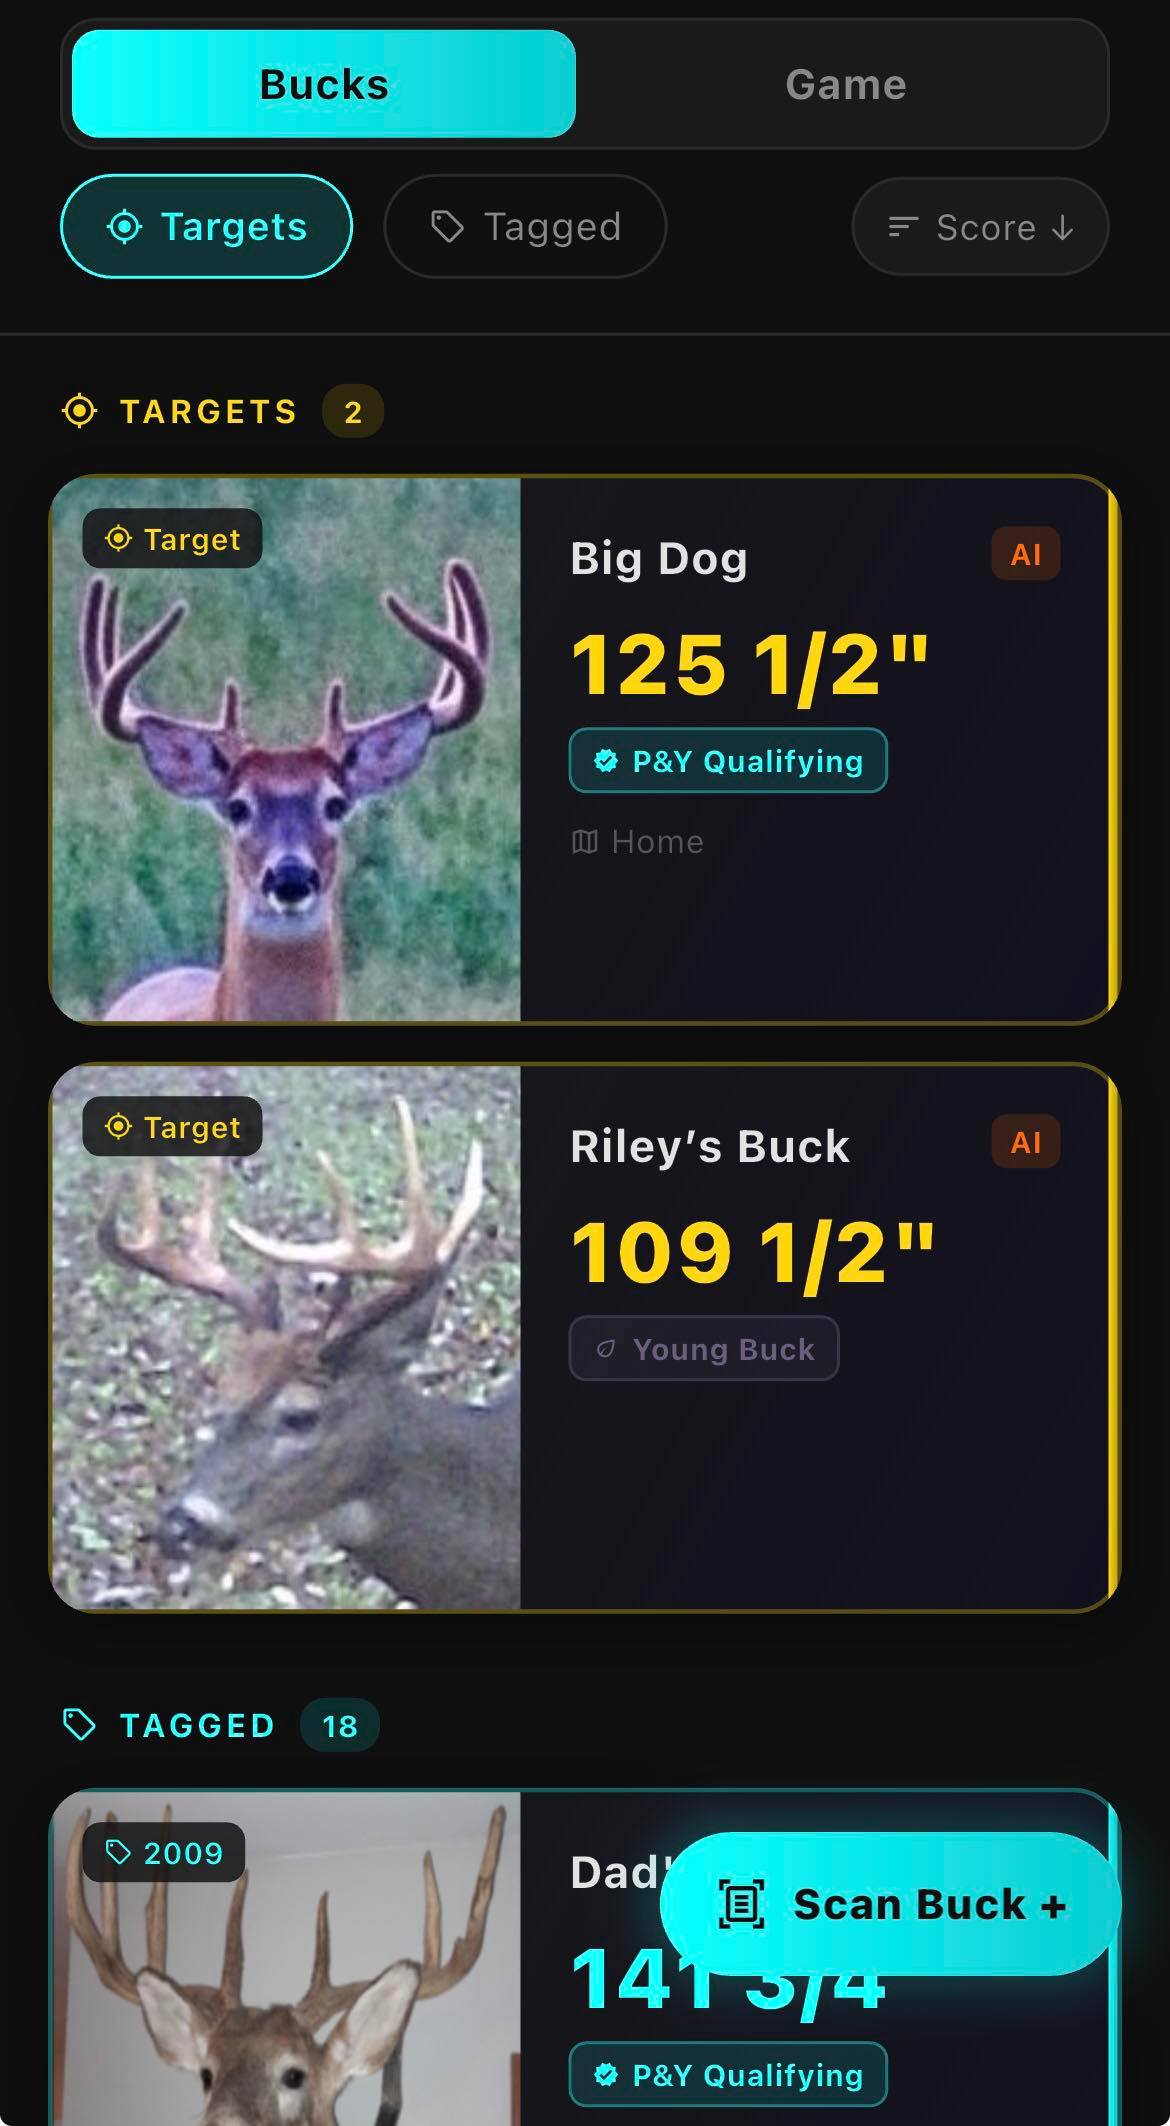
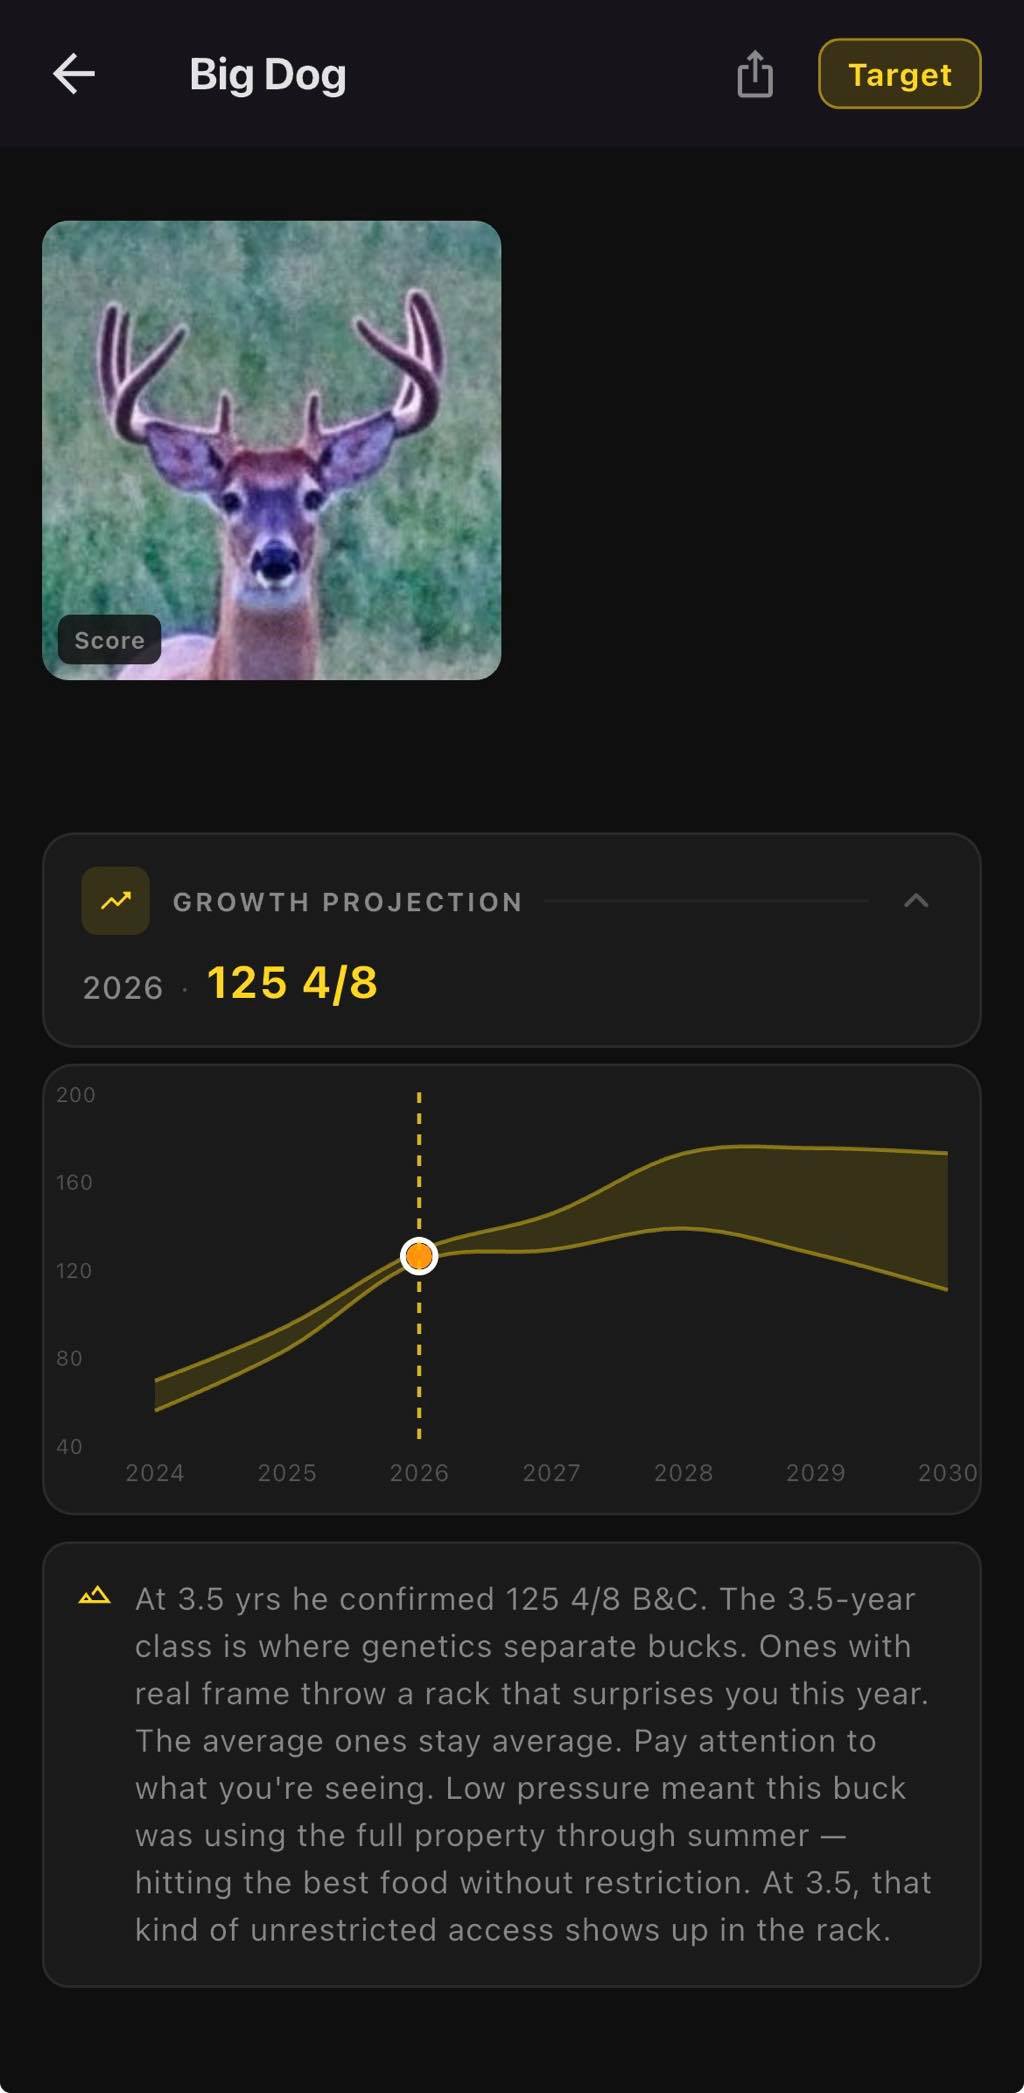
Growth curve — age-class shape
the app's internal curve, inspired by the published age-class research linked above — not a transcription of any one paper's exact table
Score as a fraction of a buck's own eventual peak, by age:
| Age | 1.5 | 2.5 | 3.5 | 4.5 | 5.5 | 6.5 | 7.5 | 8.5 | 9.5 |
|---|
| Fraction of peak | 0.40 | 0.57 | 0.73 | 0.88 | 1.00 | 0.97 | 0.91 | 0.83 | 0.76 |
The app also detects four alternate growth "styles" — early bloom, late bloom, mass-heavy, frame-heavy — each with its own curve, chosen either from real measured beam/mass/tine proportions on a scored photo, or from how a buck's actual growth between two confirmed years compares to what the standard curve would have predicted.
Peak estimation — compressed, not linear
if score at age ≤ typical-for-age:
peak_estimate = score / curve_fraction_at_age // straightforward back-calculation
else:
overAvg = score - typical_for_age
peak_estimate = typical_peak + (overAvg / curve_fraction_at_age) · 0.45
// only 45% of early over-performance carries through to peak
Typical-for-age and typical-peak (138" B&C) come from a baseline population curve built into the app. A buck that's already trending above that baseline gets a real peak bump — just not a 1-to-1 one.
Property quality multiplier
raw = food·0.30 + pressureResistance·0.25 + cover·0.22 + edgeComplexity·0.15 + rutActivity·0.08
property_multiplier = 0.93 + raw · 0.14 // tight range: a great property adds ~7%, a poor one costs ~7%
Same underlying property coefficients used in Property Movement's Hunt Window and in Predict's terrain scoring — one real analysis of your land, reused everywhere it's relevant.
Projection uncertainty — widens with distance from real data
distance from nearest confirmed year uncertainty band
1 year ± 6%
2 years ± 11%
3 years ± 16%
4+ years ± 22%
This is the literal source of the widening shaded band on the chart — it's not decorative, it's the model being honest about how much less it actually knows the further out you look.
AI detection model
on-device inference, no network call during detection or scoring
A YOLOv8-seg-style instance-segmentation network, running on-device via TFLite. Input: a 640×640 RGB frame. Output: box coordinates + 6 class scores + 32 mask coefficients per anchor, blended against 160×160 prototype masks to produce a real pixel outline per detection — not a bounding box.
classes = [beam, brow_tine(G1), other_tine(G2+), abnormal_point, eye, nose]
confidence_threshold = 0.18
per-class NMS IoU = [0.45, 0.30, 0.30, 0.30, 0.45, 0.45]
Scale calibration — eyes and nose as a biological ruler
There's no ruler in a trail-cam photo, so the app calibrates pixels-per-inch from known adult-whitetail biology, blending whichever reference signals the photo actually gives it:
| Reference | Assumed size | Calibration weight |
|---|
| Eye-to-eye distance | 6.0 in | 1.00 (strongest) |
| Eye → nose distance (near/far) | 10.0 in | 0.65 / 0.55 |
| Eye diameter | 1.85 in | 0.30 (daylight only) |
| Nose height | 2.80 in | 0.20 (daylight only) |
Eye- and nose-area calibration is disabled at night — infrared pupil dilation corrupts that signal, so the engine drops those weights entirely rather than let a bad estimate through.
Score formula — real Boone & Crockett structure
spread_credit = min(measured_spread, longer_main_beam) // real B&C inside-spread rule
gross = spread_credit + beam_L + beam_R
+ Σ(tines_L) + Σ(tines_R)
+ Σ(mass_L) + Σ(mass_R)
symmetry_deduction = Σ |left_measurement - right_measurement|
// an unpaired tine deducts its full value
net_typical = gross - symmetry_deduction - abnormal_points
net_non_typical = gross - symmetry_deduction + abnormal_points
This exact formula is the single source of truth shared across AI scoring, manual entry, and the multi-photo average — one scoring function, three ways to feed it measurements.
Confidence tiers — driven directly by photo angle
head angle <5° or >175° → Very Low "Extreme head-on or away angle"
toward-facing + dual-eye calibration → High "Toward view · dual-eye calibrated"
toward-facing + single calibrator → Medium "Toward view · single calibrator"
angled + dual-eye calibration → Medium "Angled view · dual-eye calibrated"
no usable scale reference → Very Low "No scale reference detected"
side-on view → Low "Side view · ±30% typical accuracy"
If no calibrator produces a usable estimate, the app doesn't fall back to a guess — it refuses to score: "Couldn't Score This Photo — we couldn't get a reliable measurement from this photo. Try a clearer photo with both eyes and the nose visible, or better lighting."
Multi-photo averaging
Up to 3 photos of the same buck, each scored independently, then combined as a confidence-weighted average per measurement — High-confidence photos count roughly 2.5× more than Low-confidence ones in the final number, so one bad-angle photo can't drag down two good ones.
Where the model stands today: this is an actively-training model, and accuracy will keep moving as the training set grows — that's the honest state of a Beta feature, not a hedge.